Exploring the Criteria, Recent Modifications, and its Implications
The Census Bureau delineates urban areas after each decennial census to tabulate and present data for urban populations in the United States. Urban areas represent densely developed territory consisting of residential, commercial, and non-residential land-uses. Following the decennial census in 2020, the bureau increased its minimum population threshold classifying regions as urban areas. As a result of this revision, over 1,000 regions nationally, and 56 regions in the state of Illinois lost their status as urban areas. But what do these definitions mean, and why do they matter? In this article, we understand how the bureau classifies urban and rural areas, what’s changed, and how this information impacts data users and decision makers.
Title
Drawing the Boundary
To draw a precise boundary between an urban and rural area is a challenging task, consisting of many conflicting ideas. The Census Bureau recognizes that urban areas encompass a range of densities and land uses, and therefore employs several criteria to establish consistent classifications of urban areas across the country. The boundaries of these areas are primarily determined by population and housing unit counts and densities. Additionally, criteria such as impervious land cover, identification of land-uses that complement urban areas, and commuting patterns are also considered when delineating these boundaries. The steps involved in defining the boundary are as follows:
-
An initial selection of urban areas is done by aggregating census blocks that meet a minimum housing unit density of 425 units per square mile. This information is supplemented with land-cover data to identify regions with high degrees of impervious land cover.
-
Among these, an area is designated as an urban area if it contains a population of at least 5000 and/ or 2000 housing units.
-
Additional criteria are considered to define the urban boundary and to ensure non-residential uses that supplement urban uses are included within this boundary. These include commercial, industrial, institutional, and open space uses.
-
Census blocks with high degrees of impervious land cover are included if they are at least 0.15 square miles large, within 0.5 miles of the urban area. Additionally, worker flow data from LODES (Longitudinal Employer-Household Dynamics) is considered as a proxy measure for social and economic interactions between regions to identify non-contiguous regions that behave like a cohesive urban unit.
-
Group quarters adjacent to urban areas are added if they contain at least a density of 50 people per square mile.
-
“Hops” of 0.5 mile and “Jumps” of 1.5 mile are employed to add areas that qualify as urban but geographically separated from the core region by “non-urban” intervening areas. Hops and Jumps are permissible along roads from the urban core, with no hops allowed after a jump, and only one jump allowed in each direction along a given road.
-
Currently functioning airports within 0.5 miles of an urban area with an annual enplanement of at least 2,500 passengers are included.
Any region located beyond the boundaries set by these criteria is classified as rural. The bureau revisits and updates these criteria every ten years to keep up with newly available data and advancements in geographic information technology. These updates allow the bureau to collect and present data more efficiently and accurately.
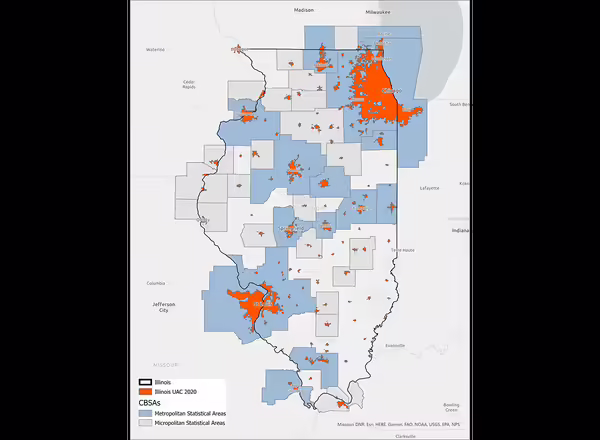
Related: What are Metropolitan and Micropolitan Statistical Areas?
A Core Based Statistical Area (CBSA) is a is a county or group of counties that consists of at least one core urban area with a population of above 10,000.
If such a region has a core of above 50,000 population, it is a Metropolitan Statistical Area, and if it is above 10,000 and below 50,000, it is a Micropolitan Statistical Area.
The counties in a CBSA contain substantial population and economic integration to the core urban area. It is measured using commuting patterns from the neighboring counties to the county containing the core. While Urban Area boundaries are drawn around census blocks based on densities and land-use, CBSAs are drawn based on using counties as the unit of measurement. Not all Urban Areas are part of a CBSA.
What Changed in 2020
In March 2022, the Census Bureau released updated criteria for defining urban areas. In this section, we explore these revisions and why they were made.
- Increase of population threshold – The minimum population of a region to count as an urban area was increased from 2,500 to 5,000. The previous threshold, used since 1910 was deemed no longer valid in determining the characteristics of an urban area.
- Elimination of Urban Area type distinction – Previously, urban areas were further categorized as "Urbanized Areas" and "Urban Clusters" based on a secondary threshold of 50,000 population. However, this distinction was removed in the revision because analysis revealed that there is little difference in economic activities and characteristics between regions on either side of the threshold. As a result, all urban areas are now referred to simply as "Urban Areas."
- Addition of Housing Units as a criterion – Areas with a minimum of 2,000 households are now considered as an additional or alternate criterion for identifying urban areas. This criterion allows for the inclusion of densely developed areas with below-average household populations, as well as seasonal communities, in the roster of urban areas. The number 2,000 was chosen as it is in line with the population threshold of 5,000 considering the national average of 2.5 members per household.
By incorporating housing unit counts, which are more frequently updated through the Census Bureau's Master Address Files, alongside the decennial population counts, the bureau can facilitate more timely updates to the urban area data. Although this has not been done yet, it provides the opportunity to use a stable measure for capturing changes in the urban landscape and population dynamics between census cycles.
How does this change impact data users?
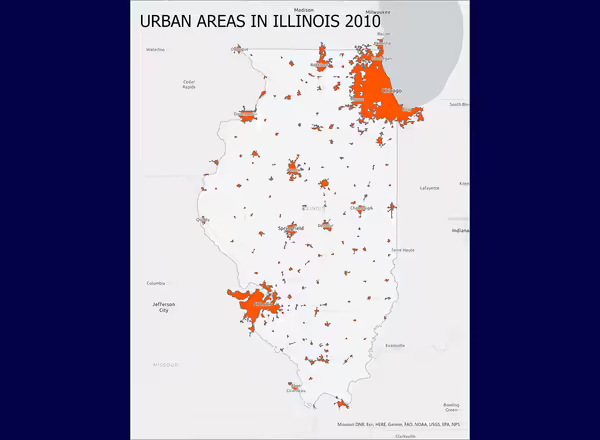
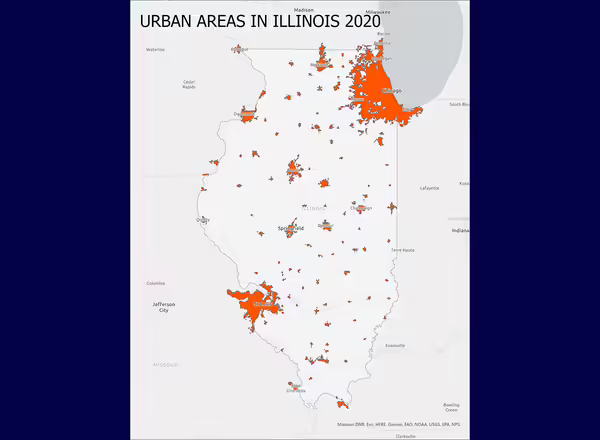
Following this change, several “urban clusters” in Illinois lost their status as an “Urban Area” in 2022. The figure below illustrates where such regions are located. The most significant impact from this change is how frequently such regions receive data. Urban areas have unique economic characteristics and their boundaries often cross county and state lines. The Census Bureau uses urban areas as one of the geographic units to provide ACS data, which is useful for decision makers. Areas that lost urban status will now receive data less frequently, and only for the geographic unit of the county it belongs to and its components.
While policymakers and leaders worried that this loss of status would also affect funding programs in the state, the Census Bureau argues that it has no control over how government agencies use this data to distribute funding. While this is true, several federal agencies utilize census data as a starting point to define their own criteria for classifying urban and rural areas. The Federal Transportation Authority (FTA) designates funds for urbanized areas annually based on a threshold of 50,000 population. Similarly, the Health Resources and Services Administration (HRSA) uses a combination of census data and commuter flow data to define areas as rural. Under this definition, areas qualifying as rural are eligible to apply for health grants.
In conclusion, understanding the delineation of urban and rural areas by the Census Bureau serves as a foundation for informed decision-making. The recent revisions have brought about significant changes to the classification of regions across the United States, particularly in Illinois. Understanding these definitions allows us to utilize the data effectively, whether as policymakers, leaders, or data users, and provide for the needs of our communities.
Author
Priyadarshini Satish, Illinois State Census Data Center, University of Illinois Extension
References
- Bureau, U. C. (n.d.). Redefining Urban Areas following the 2020 Census. The United States Census Bureau.
- Census Bureau. (2022, December 29). Federal Register
- Defining Rural Population | HRSA. (2022, March).
- Differences between the Final 2020 Census Urban Area Criteria and the 2010 Census Urban Area Criteria. (n.d.). U.S. Census Bureau.
- Kennedy, Z. (2017, August 30). Defining Rural: A Look at Two Popular Definitions: University of Illinois Extension.
- Ratcliffe, M. (n.d.). A Century of Delineating a Changing Landscape: The Census Bureau’s Urban and Rural Classification, 1910 to 2010. U.S. Census Bureau.
- Schneider, M. (2022, December 29). Do you really live in an “urban” area? The government just pushed 3.5 million Americans into the “rural” category. Fortune.
- Urbanized Area Formula Grants - 5307 | FTA. (n.d.).