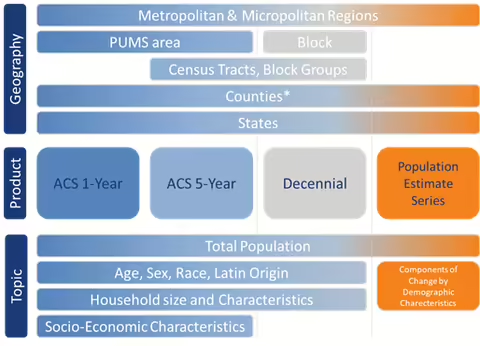
Each year, the U.S. Census Bureau collects and publishes data under several product lines with similar data points. Determining which dataset is most suited to your needs can be challenging. This page details the purpose and methodology of the most frequently used products released by the Census Bureau to help you select the most suitable data for your needs.

The Decennial Census provides a comprehensive count of every person and household in the United States, as reported on the April 1 every 10 years. It covers demographic and household characteristics such as age, sex, race, Latin origin, household size, relationships, and housing tenure. The data is generally available at the census block level, offering insights into "who we are."

The ACS is a sample survey that delves into more detailed topics compared to the Decennial Census. It includes questions about income, travel behavior, employment, and education. The ACS provides estimates based on a selected proportion of the population, with 1-year estimates available for larger geographic regions and 5-year estimates for smaller areas up to the census block-group level. While 1-year estimates consist of samples from a single year, 5-year estimates are an average of samples collected from the 5-years prior to the release. The sampling methodology indicates that ACS data comes with varying statistical reliability. The ACS focuses on understanding "how we live."

This annual release provides projections of the country's, states', and counties' population based on components of population change: births, deaths, and net migration. Birth and death data come from the National Center for Health Statistics (NCHS), while migration data is estimated using various sources like IRS, Medicare registrations, SSN tracing, and Group Quarters population changes. This data is added to the decennial population data to provide estimates on each of the components of population change. The data also serves as a measure to tune the accuracy of ACS 1-year data.
When it comes to choosing the right dataset, we must consider questions about the data topics, the sampling methodology, and the timing of the release. The products released by the Census Bureau vary in these aspects, making them more or less suited for differing needs.
Questions to consider when choosing a census data product
Topics
- What topics were surveyed?
- What geographic region is the data available for?
Sampling Methodology
- Who was surveyed?
- When was the data collected?
- How reliable is the data?
Timing
- Are you tracking a trend or a specific point in time?
- When was the data released?
When selecting a dataset, consider whether your analysis focuses on a specific geographic location or a specific topic. By examining these aspects, you can identify overlaps and narrow down your choices. If you still have multiple options, take into account the sampling methodology and timing of the data release to make a more informed decision.
ACS - The Census bureau randomly selects around 3 million households across the nation to participate in the ACS every year. This sample is used to estimate data about the characteristics of the population. For smaller geographies, the sample size is too small to provide reliable or accurate estimates every year. Hence, the characteristics of these regions are only available as 5-year estimates. Geographic areas with more than 65,000 people receive 1-year estimates. While 5-year estimates portray the average characteristic of the region over the previous 5 years, 1-year estimates are more current. 1- year estimates capture dynamic changes in the population, but with generally less statistical reliability, or larger margins of error.
Decennial data is an enumerated count of the entire population and is hence the most accurate data. However, depending on when your study period is, the data might be anywhere between 1 to 10 years old.
Population Estimate Series – Different components of this data have varying accuracy and data collection periods. Birth and Death data is procured from the National Center for Health Statistics (NCHS) with a 2-year lag. Migration data is calculated using different data for different age groups and consists of net domestic migration and international migration as its components. Each year, the Census Bureau generates a new set of estimates known as a "vintage," incorporating the most recent data. These vintage estimates not only provide updated figures for the current year but also revise and refine all previous years' estimates, tracing back to the most recent decennial census. The population estimate series is the most widely used data source for reporting and publishing population counts.
Margin of error refers to the range of potential error or uncertainty associated with survey estimates. It provides a measure of the variability that could exist if the same survey were repeated multiple times. The margin of error indicates the distance between the estimated value from a sample and the true value in the population.
Suppose a census survey estimates that the median household income in a particular county is $50,000 with a margin of error of ±$2,000. This means that if the survey were repeated multiple times, the average household income could vary by up to $2,000 above or below the estimated value of $50,000.
With smaller sample sizes, margins or error are higher. For example, if a survey estimates that 15% of households in a neighborhood have no vehicles with a margin of error of ±12%, then the true estimate value would lie anywhere between 3% and 27% of households. Such a wide range indicates a significant level of uncertainty and makes it challenging to draw meaningful or accurate conclusions from the data.
Timing refers to whether the analysis requires a snapshot of a specific point in time or an examination of trends over time. For long-term trends spanning multiple decades, decennial data is recommended. For more current information, ACS or population estimate series data is available. The choice between these sources for overlapping data topics depends on the desired currency or accuracy of the data.
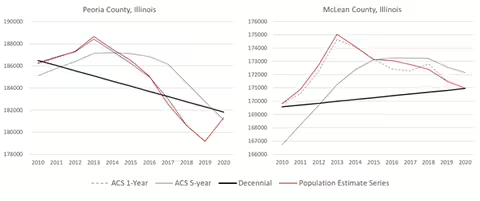
5-year ACS data captures long-range trends, while 1-year data captures more dynamic changes in population characteristics. The figure below illustrates the difference in estimates over a 10-year period for two Illinois counties. The smoothness of the lines in the 5-year ACS demonstrates its ability to capture trends. The population estimate series is built upon the most recent decennial data, with counts released for the July 1 each year. This differs from the decennial data reporting date of April 1st. Estimation methods for the population estimate series are reset with every decennial release.
What to Choose?
While there are no hard and fast rules, organizations and researchers can make informed decisions by evaluating the trade-off between accuracy and currency. This article has provided insights into the purpose, methodology, and timing of the most frequently used census data products. Additionally, the Census Bureau offers a vast array of other data sources, further expanding the options available. Similar tradeoffs can be considered while choosing between any of those options. To narrow down what data products or surveys are best suited for your needs, use the Census Survey Explorer. This tool allows you to find available surveys by filtering through geographies, release frequencies, and topics. Learn how to use this tool through this quick tutorial. By harnessing the wealth of data provided by the Census Bureau, communities can derive meaningful insights for data-driven decision making.
Summary of characteristics of each product
| Decennial Census | ACS 5-Year Estimates | ACS 1-Year Estimates |
Population Estimate Series
|
|---|---|---|---|
|
|
|
|
|
References
U.S. Census Bureau. (2020). Understanding and Using American Community Survey Data: What All Data Users Need to Know. Washington, DC: U.S. Government Publishing Office
Census Bureau. (n.d.). Census Survey Explorer (beta)
U.S. Census Bureau. (2021, December 1). Population Estimates: Start of the Decade. Census Bureau Blogs - Random Samplings


