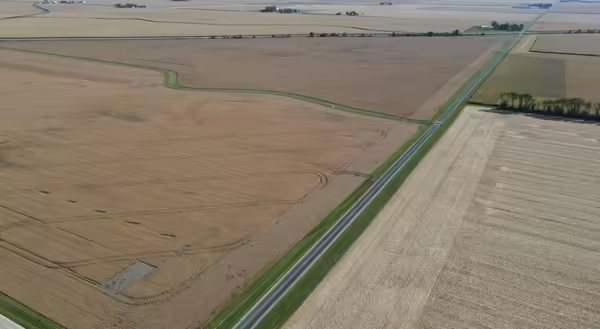
Farmland values began to soften in late 2024. With decreasing farm profits in 2023 and 2024, farmland values held firm until the last quarter of 2024. This was the consensus of professional farm managers at the 2025 Illinois Farmland Values and Lease Trends Conference held in March, which The Illinois Society of Professional Farm Managers and Rural Appraisers facilitates.
Sales Were Variable by Location
The value of farmland varied across the ten regions analyzed across the state. Sales were analyzed by soil productivity indexes as defined by Bulletin 811: a rating system commonly used in Illinois to compare farms by how productive soils are compared to other soils. What held true in one district was not necessarily the same in another. However, a noticeable softening of land values was occurring in the last quarter of 2024.
Western Illinois sales of Excellent farmland suffered the most significant declines in Excellent farm values. The areas bordered by the Chicago metro area saw increases in all farmlands. In the southern part of the state, farmland sales per acre were steady to considerably higher, with strong sales values reported in the far south.
Sales Levels Were Different by Soil Type
Farms by soil type showed differences but were inconsistent across various locations. Average sales per acre across the state showed a modest decrease in Excellent soil types ((Productivity Index (PI) 133 to 147)). Good Soils (PI 117 to 132) were, on average, flat to slightly down. Average and Fair soils showed a modest increase in sales values per acre- the same trend held for median prices compared to average prices.
Estate Auctions Account for Many Farm Sales
Farmland sales increased slightly in 2024 over the previous year, except for Average farms, which experienced a noticeable decrease in farmland sales. Estate Sales contributed to 59% of the farms sold. Retired farmers and investors represented 13% and 12% of the farm sales, respectively. Six percent of the farms sold were by active farmers. Some of the sales by active farmers were to improve cash positions (five percent of sales). Due to increased transportation costs and operational efficiencies, other farmers are reluctant to travel long distances to farm tracts. Some farmland investors sold to invest in different types of assets.
Farmers are the Majority of Farmland Buyers
Public auctions accounted for 53% of farm sales, while 27% were private. Farmers purchased 59%, and non-farming buyers represented 30% of the purchasers. Non-local investors represented 13 percent of the buyers, and institutions came in at 6%. As these stats show, farmers are the leading investors in farmland. There was a decrease in year-over-year sales volume for the final quarter of 2024 compared to 2023.
Where are We Heading with Land Values
Farm profits in 2025 will impact future farm values. Interest rate uncertainty, lower grain prices, and trade war concerns will cause headwinds holding back values. A farmland market analysis would be remiss not to compare 1980 to the present. A sharp acceleration of the above-mentioned factors caused the economic devastation of the 1980s farm depression.
You may recall we saw a decline in farmland values in 2019, but they quickly rebounded into a strong market until the challenges in late 2024. The uncertain future of the USDA and trade policy will have an impact, but it’s hard to say right now if it will be positive or negative. Farm operators maneuvering to improve cash positions is a management decision to be weighed carefully. The types of decisions and preparations made during uncertain times will strongly influence the outcome.