Fertilizer is a critical input for crop production, supplying essential nutrients that boost yields and support global food security. In recent years, however, fertilizer markets have experienced significant volatility. From 2020 to 2022, U.S. fertilizer prices more than doubled due to increasing energy costs, global supply chain disruptions, and geopolitical tensions. Although prices decreased in 2023, they are still higher than pre-pandemic levels, resulting in increased costs for farmers and tighter profit margins. This post discusses a recent report by the United States Department of Agriculture Economic Research Service (USDA-ERS) on how the U.S. fertilizer supply has evolved, why fertilizer costs account for such a large part of farm expenses, and what factors contribute to price fluctuations. For producers in Central Illinois—where corn and soybean production depend on fertilizer—understanding these trends is crucial for planning input purchases, managing risks, and maintaining profitability in an unpredictable market.
U.S. Fertilizer Supply
Fertilizer production depends on different forms of natural resources. Natural gas is essential for the production of nitrogen fertilizers, such as anhydrous ammonia and urea. Phosphate rock, along with ammonia, is necessary for phosphorus fertilizers such as monoammonium phosphate (MAP) and triple superphosphate (TSP). Potassium fertilizers such as potassium chloride are derived from mining potash. While the U.S. has abundant resources of natural gas and phosphate, potash is not as abundant and thus requires imports from other countries.
In 2022, the U.S. produced 36.6 million metric tons of fertilizer nutrients, about 8.4% of global output, but its share of world production has fallen by more than 25% since 2006. Overall production declined 5.1%, driven by a 42% drop in phosphate output, even as nitrogen production rose 67.5%, making nitrogen the dominant nutrient at 61% of U.S. production. Potash production remained minimal, supplying less than 5% of domestic needs. In 2022, the U.S. imported 10.7 million metric tons of fertilizer and exported 3.2 million, resulting in a trade deficit. Potash accounted for 42% of imports, with 95% of U.S. potash demand met by imports, primarily from Canada. Urea and ammonia were also major imports. On the export side, MAP and ammonia led shipments. While global fertilizer production and trade grew by 27% and 19% from 2006 to 2022, the U.S. share of production, imports, and exports all declined. This trend highlights the growing reliance on global markets and the vulnerability of U.S. agriculture to international supply disruptions.
U.S. Fertilizer Use and Cost of Production
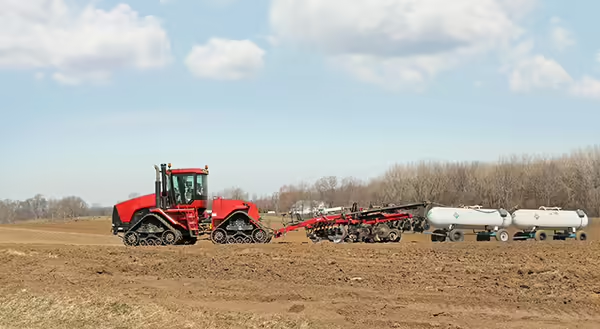
Fertilizer use in the U.S. has declined in recent years. In 2021, total consumption was about 18.3 million metric tons, with nitrogen use more than double that of phosphate and potash combined. Between 2020 and 2021, consumption dropped sharply—nitrogen by 5.8%, phosphate by 12.6%, and potash by 16.2%—as prices surged. Fertilizer is a major cost driver for crop production. For corn, it accounts for about 40% of operating costs; for wheat, about 35%. In 2022, fertilizer costs per acre hit record highs: $216.81 for corn and $79.49 for wheat, up 110% and 141% from 2010–2019 averages. Costs eased in 2023 but stayed well above historical norms. Regional differences are large: corn fertilizer costs ranged from $289 per acre in the Southern Seaboard (parts of Alabama, Georgia, and North Carolina) to $195 in the Prairie Gateway (parts of Kansas, Oklahoma, and Texas), while wheat costs were highest in the Heartland (Illinois, Indiana, and Iowa) at $107 per acre.
According to an article from Farmdoc Daily, Illinois nitrogen prices in August 2025 averaged $786/ton for anhydrous, $594 for urea, and $431 for liquid nitrogen, compared to long-term averages of $650, $440, and $300. The anhydrous-to-corn price ratio sits at 0.11, above the historical 0.09, signaling continued cost pressure despite prices being below 2022 peaks. Farmers are responding with risk management strategies. A 2024 farmdoc survey found 82% of farmers use forward purchases to lock in prices, while 39% use volume discounts and 19% bundle fertilizer with other products. Timing adjustments—splitting applications between fall and spring—are also common. Tools like the Maximum Return to Nitrogen (MRTN) calculator help farmers optimize application rates. Despite these efforts, fertilizer remains one of the most volatile and costly inputs, making price management a top priority for farm profitability.
Factors Contributing to Trends in Fertilizer Prices
Fertilizer prices are shaped by a mix of global and domestic factors, and recent volatility highlights how interconnected these markets have become. The USDA report outlines several key factors that can cause instability in the global fertilizer market, and thus cause price fluctuations that can impact producers in Central Illinois and across the United States.
Energy Costs
Nitrogen fertilizer is the most energy-intensive to produce, and natural gas is its key input. When natural gas prices spike, nitrogen prices typically follow. From 2020 to 2022, natural gas prices nearly tripled, pushing anhydrous ammonia to a record $1,665 per ton in spring 2022 before falling back near historical averages in 2023. While prices have eased, they remain sensitive to energy markets.
Geopolitical Events
Conflicts and trade policies have added major uncertainty. The Russia-Ukraine war disrupted global fertilizer flows, as Russia and Belarus are major exporters of nitrogen and potash. Sanctions and export quotas tightened supply, while China restricted phosphate and urea exports to protect domestic markets. These actions amplified price volatility worldwide.
Natural Disasters and Logistics
Hurricanes, freezes, and drought have repeatedly disrupted U.S. fertilizer production and transportation. For example, Hurricane Ida in 2021 and Hurricane Ian in 2022 shut down Gulf Coast plants and delayed shipments. Low water levels on the Mississippi River in 2022 slowed barge traffic, creating delivery bottlenecks during critical application windows.
Crop Prices and Demand
Fertilizer demand often tracks crop prices. When corn and wheat prices rise, farmers are more willing to invest in higher fertilizer rates to maximize yields. This link was evident in 2021–22, when strong grain markets coincided with record fertilizer prices.
Export Restrictions
Policies from major suppliers can quickly ripple through global markets. Russia’s nitrogen export quotas and China’s phosphate restrictions tightened supply during 2021–22, while sanctions on Belarus reduced potash availability. Even temporary measures can cause sharp price swings.
Together, these factors create a highly dynamic market where energy costs, global trade, and weather events interact with farm-level decisions. While prices have moderated since 2022, the underlying drivers remain in play, leaving fertilizer markets vulnerable to future shocks.
This blog examined a recent USDA report into the forces shaping fertilizer markets—information that is especially valuable for producers in Central Illinois, where corn and soybean production depend on fertilizers. While prices have eased from the record highs of 2022, they remain above historical averages, keeping fertilizer as one of the most significant and volatile costs in crop production. For Central Illinois farmers, this means continued pressure on margins and the need for careful planning. Strategies like forward pricing, timing adjustments, and using tools such as the MRTN calculator can help manage risk, but global factors—energy markets, trade policies, and weather disruptions—will continue to influence local decisions. Understanding these dynamics is essential for making informed input choices and maintaining profitability in an uncertain market environment.


