Weather/Climate Information: Report provided by Trent Ford, Illinois State Climatologist
The following description of temperatures, precipitation, severe weather, and drought comes from data compiled by networks that report to the National Oceanic and Atmospheric Administration (NOAA). These data are provisional and may change slightly over time.
February in Illinois was much warmer and much drier than average statewide.
Temperatures:
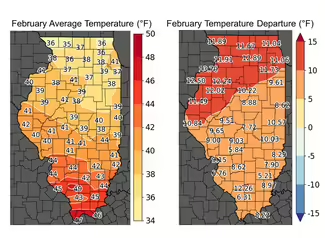
Temperatures averaged 41.0°F, 9.9° above the 1991-2020 normal for February and the 2nd warmest on record (Table 1a, Figure 1). February average temperatures ranged from the mid-30s in northern Illinois to the high 40s in southern Illinois, between 6 and 12 degrees above normal (Figure 1). Several stations saw daily high temperatures in the 80s last month, including 83 degrees in Belleville and 80 in Springfield. A strong cold front in the last week of the month dropped temperatures from the 70s and 80s into the teens and 20s. Several places saw 50- to 60-degree declines in less than 24 hours. Overall, the warmest place in the state last month was Du Quoin, with an average temperature of 49.1 degrees, and the coldest place in the state was Stockton in Jo Daviess County with an average temperature of 34.8 degrees.
The mild weather in February broke 186 daily high maximum temperature records. These included a 75-degree high in DeKalb on February 28, which beat the previous daily high record by a full 12 degrees. There were also 43 daily high minimum temperature records broken last month. Twenty-two locations in Illinois set new all-time February high temperature records, including 77 degrees in Peoria, 77 in Charleston, 76 in Moline, and 73 in Rockford. Last month was the warmest February on record in Chicago, Rockford, Moline, and Peoria and in the top 5 for warmest February virtually everywhere in the state.
Precipitation:
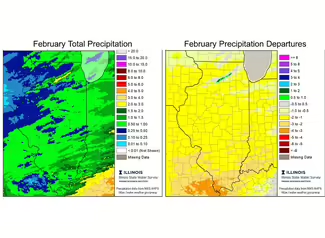
Precipitation statewide in February was 0.43 inches, 1.68 inches below the long-term statewide average and the 2nd driest February on record (Table 1a). Total February precipitation ranged from less than half an inch in parts of western Illinois to around 3 inches in parts of northern Illinois (Figure 2). Most of the state was 1 to 3 inches drier than normal last month, while only a narrow stretch of northern Illinois caught more than normal precipitation.
Last month was the 7th driest on record in Rockford (0.29 inches total), the 8th driest in Moline (0.26 inches total), the 6th driest in Springfield (0.51 inches total), the 3rd driest in Normal (0.14 inches total), the 3rd driest in Quincy (0.07 inches), and 4th driest in Carbondale (0.74 inches). In fact, February was the 7th driest month on record (for any month) statewide in Illinois, and the driest since January 1981.
Snow:
February total snowfall ranged from less than two-tenths of an inch in northwest Illinois to just over 5 inches in central Illinois. Only the Interstate 70 corridor was above normal on February snowfall, while most of northern Illinois was 4 to 10 inches below normal. The big January snowstorm in the Quad Cities area keeps that region above normal on season-to-date snowfall, while most of the rest of the state is 5 to 15 inches behind normal snowfall by March 1.
Winter:
February ended yet another very mild climatological winter season that featured only one truly cold air outbreak. The season began with the 3rd warmest December on record statewide, followed by a mostly mild January split in two by extreme cold. An incredibly mild February put a cap on a winter with average temperatures that were 4 to 8 degrees above normal in Illinois. Overall, the winter average temperature was 35.7°, 6.0° above normal and the 2nd warmest winter on record in Illinois.
The very dry February in Illinois followed a very wet January and a mixed bag of wetter and drier than normal conditions in December. Overall, winter total precipitation ranged from less than 5 inches in northwest Illinois to over 10 inches in far southern Illinois. Most areas north of Interstate 64 were near to 1 to 2 inches wetter than normal last season, while far southern Illinois was 1 to 2 inches drier than normal in winter. Overall, total winter precipitation in Illinois averaged 7.39”, 0.54” above the 30-year normal and 38th wettest on record statewide.
Table 1a. February temperature and precipitation summaries.
|
|
Temperature (°F) |
Departure from normal (1991-2020) |
Precipitation (in) |
Departure from normal (1991-2020) |
|
Illinois |
41.0 |
9.9 |
0.43 |
-1.68 |
|
CRD 1 (northwest) |
38.1 |
12.2 |
0.28 |
-1.44 |
|
CRD 2 (northeast) |
38.0 |
11.1 |
0.54 |
-1.23 |
|
CRD 3 (west) |
40.9 |
10.3 |
0.20 |
-1.67 |
|
CRD 4 (central) |
39.9 |
10.2 |
0.34 |
-1.54 |
|
CRD 5 (east) |
38.8 |
9.3 |
0.52 |
-1.38 |
|
CRD 6 (west southwest) |
42.4 |
9.4 |
0.31 |
-1.74 |
|
CRD 7 (east southeast) |
41.7 |
8.5 |
0.47 |
-1.84 |
|
CRD 8 (southwest) |
45.3 |
8.4 |
0.58 |
-2.16 |
|
CRD 9 (southeast) |
45.0 |
8.1 |
0.78 |
-2.25 |
Table 2. Winter (December – February) temperature and precipitation summaries.
|
Temperature (°F) |
Departure from normal (1991-2020) |
Precipitation (in) |
Departure from normal (1991-2020) |
|
|
Illinois |
33.7 |
29.8 |
7.39 |
0.54 |
|
CRD 1 (northwest) |
28.1 |
24.9 |
7.78 |
2.47 |
|
CRD 2 (northeast) |
29.6 |
26.1 |
7.92 |
2.20 |
|
CRD 3 (west) |
31.4 |
28.2 |
6.37 |
0.74 |
|
CRD 4 (central) |
32.9 |
28.4 |
7.01 |
0.91 |
|
CRD 5 (east) |
32.5 |
28.3 |
6.75 |
0.41 |
|
CRD 6 (west southwest) |
35.2 |
31.5 |
5.99 |
-0.67 |
|
CRD 7 (east southeast) |
36.6 |
31.9 |
7.40 |
-0.51 |
|
CRD 8 (southwest) |
39.3 |
35.2 |
9.89 |
1.00 |
|
CRD 9 (southeast) |
39.9 |
35.3 |
10.72 |
0.77 |

