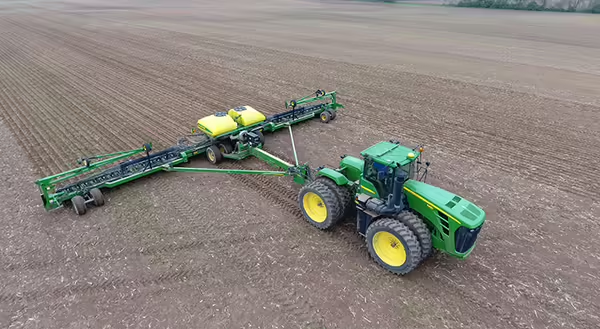
The agricultural landscape in the United States is constantly evolving, and understanding the current state of farm and ranch operations is crucial for stakeholders across the industry. While the United States Department of Agriculture (USDA) conducts a complete census of agriculture every five years, a series of reports highlights various topics every year. The USDA America’s Farms and Ranches at a Glance: 2024 Edition report comprehensively overviews the key aspects shaping American agriculture, using data from 2023. This first part of a two-part blog series will begin digging into the report by examining the diverse classifications of farms and their unique characteristics. This post will also explore the distribution of farms, production, and farmland, highlighting the significant contributions of different farm types to the nation's food supply. This post will analyze farm financial performance, shedding light on the economic health of various farm sizes and types. Finally, this post will discuss the use of credit and loan amounts in the agricultural sector, providing insights into how farmers are financing their operations.
The 2024 Edition of the report begins by discussing the classification of farm and ranch operations in the United States. How does the USDA define what a farm is? The USDA has used the same definition since the 1970s. A farm is any operation that produced and sold at least $1,000 of agricultural goods in a given year. The main distinction used by the USDA is whether a farm or ranch is either family or non-family. A family farm or ranch has a majority of the business owned or controlled by a person or their relative. There are additional categories of family farms based on the operation's gross cash farm income (GCFI). A previous post in this blog went through the categories of family farms; see Rent or Own: How Land Tenure Shapes Agricultural Conservation Strategies, Part One.
The 2024 Edition states that, in 2023, 96.5% of farms and ranches in the United States were family farms, with approximately 39% classified as off-farm income farms and 30% classified as low-sales farms. While small and midsized family farms operated 59% of the total acres in the United States, these farms only accounted for roughly 36% of the value of agricultural products. Looking at specific products, large family farms have the largest share of the value of production for beef (39%), hogs (37%), dairy (77%), cotton (71%), and cash grains and soybeans (52%). While small and midsized family farms may represent the largest percentage of farms and acres operated in the United States, it is large family farms that account for the most value of agricultural goods produced.
One of the measures the USDA uses to evaluate farm financial performance in this report is operating profit margin (OPM). OPM is expressed as a percentage and is calculated by dividing the operating income by net sales. A higher OPM represents that an operation is able to turn revenue into overall profit, thus placing the operation in a more stable financial position. The USDA defines low-risk operations as an OPM greater than 25%, medium-risk as an OPM between 10 and 25%, and high-risk as an OPM less than 10%. The report found that, across all farm types, 69% were considered high-risk, 9% were medium-risk, and 17% were low-risk. Small family farms had the most in the high-risk category, with 66% of retirement, 71% of off-farm occupation, 85% of low-sales, and 52% of moderate-sales farms in this category. Large and very large family farms had 42% in the low-risk category. This demonstrates that smaller family farms are in a more precarious financial position than large-scale family farms, making them more at risk for financial downturns due to inflation, volatile market prices, and higher-than-usual input prices.
The USDA report also looks at the use of debt by farms and ranches across the United States. Debt is used by farm and ranch operations to provide some capital to support their operations. The report found that 28% of all farms and ranches in the United States have debt of some kind, with the average debt across all farm types being approximately $505,000. Large-scale family farms have the highest share of farms with debt, with 75% of large and 80% of very large family farms holding some debt. The average debt for large farms was approximately $1.38 million, and the average debt for very large farms was $3.7 million. Moderate-sales farms had the highest percentage of small family farms with debt, with nearly 59% of farms in this category having debt, and the average debt among farms in this category was $479,000. But where are these farms getting their loans from? Every farm type has at least 80% of its debt held by either commercial banks, the Farm Credit System, or through the USDA. Nearly 89% of retirement farms have debt in this category, with the average across all farm types being 83%. The average interest rate for these loans was 5.5%, with off-farm occupation farms having the lowest interest rate of 5.2% and nonfamily farms having the highest rates of 6%.
This blog post is the first in a two-part series analyzing a USDA report on the state and condition of farms and ranches using data from 2023. This post went through the farm typology used by the USDA, the production statistics across all farm types, the financial performance and health of farms and ranches, and the amount of debt held by farm and ranch operations. The second post in this series will continue going through the report, highlighting government payments and farm household well-being. This report provides valuable insights into the current state of agricultural production in the United States and gives a sense of how farms and ranches are headed in 2025 and beyond.
To read the USDA report, use this link: https://www.ers.usda.gov/webdocs/publications/110560/eib-283.pdf?v=9386.3.