Weather update and outlook from Illinois State Climatologist, Trent Ford.
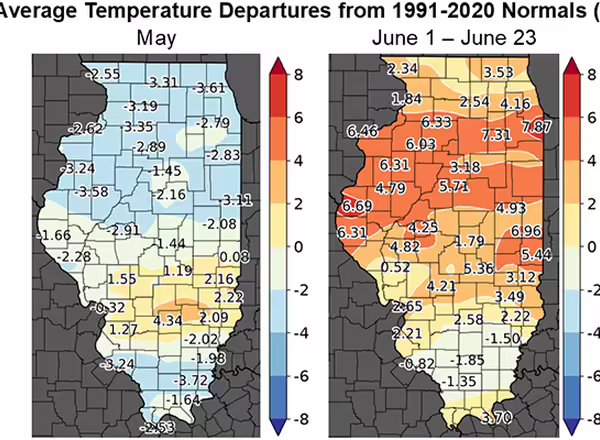
Following the warmest April on record in Illinois, May cooled us down a bit, with temperatures that were right around 1 degree below average. June temperatures have been a mixed bag of warmer conditions early in the month and very mild weather mid-month (Figure 1).
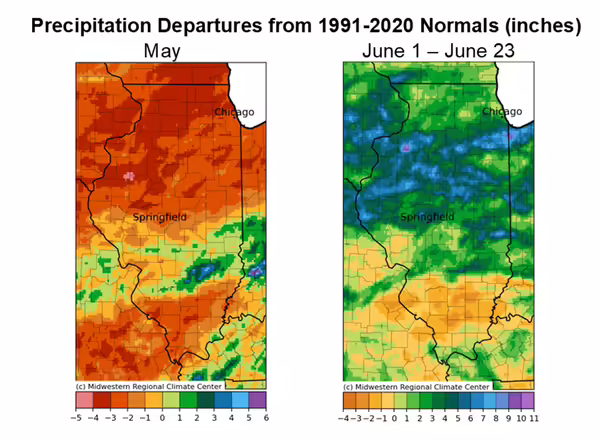
The Interstate 70 corridor was very wet in May while the rest of the state largely missed out on May rains. Once the calendar turned over to June, severe weather became the big story. As of June 24, Illinois has had over 150 tornadoes in 2026, well over the previous annual record of 142 in 2024. Not only does Illinois lead the nation in tornadoes in 2026, but we have had nearly twice as many as the next highest state, which is Mississippi. Among many noteworthy severe weather events this year, large tornadoes caused significant damage in Effingham and Charleston, and multiple fatalities in Jefferson County. With a record-breaking 70 tornadoes in April and our recent severe weather in June, 2026 is by far the most intense severe weather year in modern history in Illinois.
The severe weather in June mostly stayed north of Interstate 64 and kept most of the rain in central and northern Illinois. Most of the northern two-thirds of the state has been 1 to 5 inches wetter than normal so far in June, while parts of southern Illinois have been closer to normal if around 1-2 inches drier than normal. The month of June through the 23rd has been a top 5 wettest on record in most of central Illinois, including in Peoria, Bloomington-Normal, Champaign-Urbana, and Quincy (Figure 2).
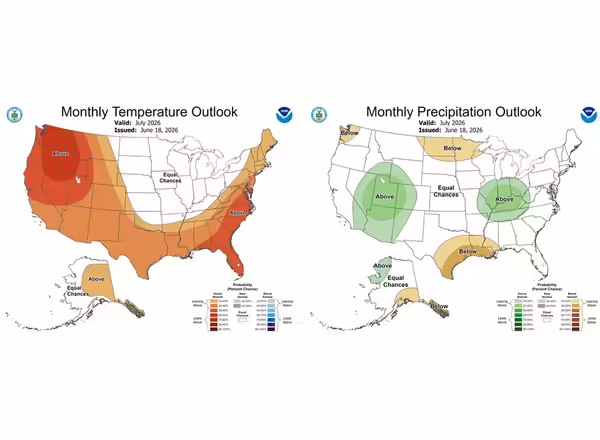
Outlooks for July do not show any signal for temperature and a stronger signal of above average precipitation. I see this as a sign of a potential for continued active storm track, with temperatures bouncing between warmer and milder, and generally stormy weather (Figure 3).